Electrify Chicago
According to the
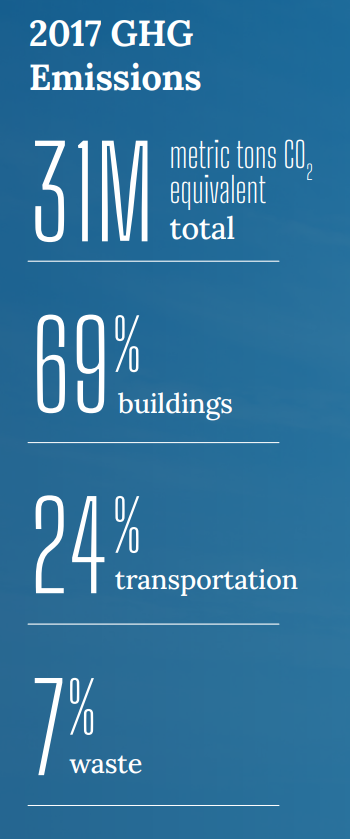
2022 Chicago Climate Action Plan ,
a whopping 69% of Chicago's emissions come from buildings, making it
our biggest challenge and our biggest opportunity as a city to tackle
change. At Electrify Chicago we want to showcase some of the best and worst performing
buildings in the city using publicly available data and manual annotations to add
building photographs and label multi-building owners like universities.
,
a whopping 69% of Chicago's emissions come from buildings, making it
our biggest challenge and our biggest opportunity as a city to tackle
change. At Electrify Chicago we want to showcase some of the best and worst performing
buildings in the city using publicly available data and manual annotations to add
building photographs and label multi-building owners like universities.
You can start by looking at Chicago's buildings with the highest greenhouse gas intensity - this means that they use the most energy when adjusted per unit of square foot, so big buildings could actually perform much better than very inefficient small buildings on this metric.
Chicago Buildings by Greenhouse Gas Intensity
Note: Data only includes large Chicago buildings from 2020
Note: This data only includes buildings whose emissions are reported
under the
Chicago Energy Benchmarking Ordinance. According to the City “As of 2016,
this list includes all commercial, institutional, and residential buildings larger than
50,000 square feet.” This dataset is also then filtered to only buildings with
reported emissions > 1,000 metric tons CO2 equivalent.
This data is also from 2020, but when new benchmark data is available, we'll update the site.
| Property Name / address | Primary Property Type |
Greenhouse Gas Intensity (kg CO2 eq./sqft) |
Total Greenhouse Emissions (metric tons CO2 eq.) |
|---|---|---|---|
|
1950 - SOUTH LOOP
1300 S Clinton St
| Retail Store | 12.0 kg/sqft
Highest 10%
| 1,281 tons
Highest 37%
|
|
840 North Michigan Avenue Acquisition LLC
840 N Michigan Ave
| Retail Store | 12.0 kg/sqft
Highest 10%
| 1,043 tons
Highest 44%
|
|
University High School
5840 S Kenwood Ave
| K-12 School | 12.0 kg/sqft
Highest 10%
| 1,089 tons
Highest 42%
|
|
North+Vine
633 W NORTH AVE
| Multifamily Housing | 11.9 kg/sqft
Highest 10%
| 2,984 tons
Highest 14%
|
|
1976 - LINCOLN PARK
2647 2679 N Halsted St
| Retail Store | 11.9 kg/sqft
Highest 10%
| 949 tons
Highest 47%
|
|
311 W. Superior
311 W Superior St
| Office | 11.8 kg/sqft
Highest 10%
| 1,081 tons
Highest 42%
|
|
207
4640 S Halsted St
| Supermarket/Grocery Store | 11.8 kg/sqft
Highest 10%
| 1,730 tons
Highest 27%
|
|
919 S California Ave.
919 S California Ave
| Other | 11.8 kg/sqft
Highest 10%
| 1,001 tons
Highest 45%
|
|
Harper Court
5235 S Harper Ct
| Office | 11.8 kg/sqft
Highest 10%
| 2,729 tons
Highest 15%
|
|
The Garland Building Office Condominium
111 N Wabash Ave
| Office | 11.8 kg/sqft
Highest 10%
| 3,062 tons
Highest 13%
|
|
Incubator Building
55 W 34th Street
| College/University | 11.7 kg/sqft
Highest 11%
| 846 tons
Lowest 49%
|
|
Walmart Supercenter #5617
4626 W Diversey Ave
| Wholesale Club/Supercenter | 11.7 kg/sqft
Highest 11%
| 1,360 tons
Highest 34%
|
|
Francis W Parker School
330 W Webster Ave
| K-12 School | 11.7 kg/sqft
Highest 11%
| 2,721 tons
Highest 15%
|
|
Park Michigan
1212 S Michigan Ave
| Multifamily Housing | 11.7 kg/sqft
Highest 11%
| 2,784 tons
Highest 15%
|
|
HAROLD WASHINGTON LIBRARY
400 S State St
| Library | 11.7 kg/sqft
Highest 11%
| 8,853 tons
Highest 3%
|
Data Source:
Chicago Energy Benchmarking Data